Practical dependency tracking for Python function calls
tl;dr
Tracking the code and data accessed by a (Python) function call is a broadly useful primitive, from drawing dependency graphs, to debugging and profiling, to cache invalidation. This post is a journey through the landscape of possible implementations, with a focus on solutions that are transparent, robust and applicable to practical production scenarios. A minimal viable implementation in <100 lines of code is included (gist); a practical implementation is part of mandala, a library for incremental computing and experiment management.
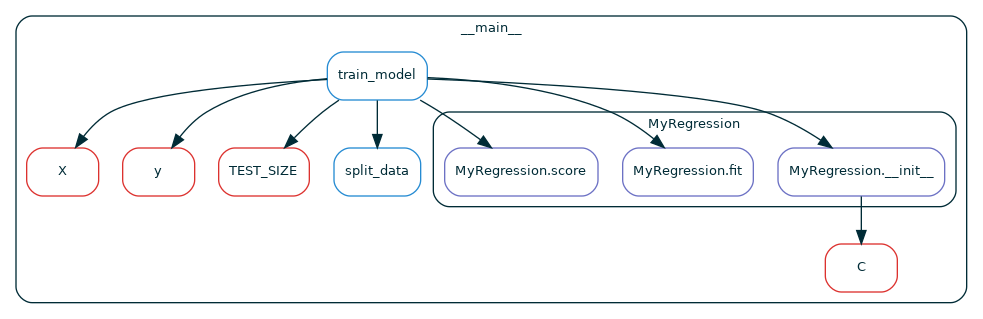 Figure. Dependencies extracted from a call to the function
 train_model
in module __main__: functions (blue), methods (purple) and globals (red)Outline
- motivation: the use case I ran into, and technical requirements that came out of it
- proposed solution: a prototype in <100 lines of code you can customize to your own use cases
- what doesn't work and why: alternative designs and why I decided against them
Motivation: efficient and reproducible computational experiments
Function dependency information is useful for all sorts of stuff, from drawing pretty call graphs to debugging and profiling to measuring test coverage. Personally, I wanted to cache function calls and detect when a cached call is no longer valid because the code and/or data it depends on have changed. This means that, for each call, you must know the exact functions/methods it called and globals it accessed.
Concretely, such a memoization tool can save a lot of computer/programmer time in computational fields like machine learning and data science. Projects there typically have many moving pieces, and each piece can change at any time. It's common for a change in one piece to affect only some steps of a project, and re-running everything from scratch takes too long: you want to do the "new" computations only.
Manually keeping track of this is error-prone and distracts you from your actual project! There exist tools like dvc that can sort of automate this, but they are generally more rigid - e.g., require you to break your code up into scripts instead of functions. Instead, I wanted something simpler to understand and add to existing code in e.g. your Jupyter notebook, so you can do your work in the most straightforward way with minimal boilerplate.
Technical requirements
Deploying dependency tracking in a production ML/DS system poses more challenges than using it for e.g. debugging/profiling, because it's now part of all the computations you do! Unfortunately, I'm not aware of a tool that meets all the requirements of this use case:
- track the dependencies actually accessed by each call (including global variable accesses) as opposed to an over- or under-estimate
- easily limit the tracked dependencies to user code (library functions typically don't change, even over relatively long projects)
- report/abort when a dependency cannot be tracked, e.g. when a function accesses a closure or a global variable that can't be hashed
- be robust and non-invasive to the main computational process so that your code behaves as it would without tracking
- introduce low performance overhead, which is particularly important in fast-feedback interactive settings, like exploratory computations in Jupyter notebooks.
- ...and more (e.g. deal with concurrency/parallelism, which we won't get to here)
As we'll see later, take together, these
requirements rule out several standard approaches: static
analyzers (which can over- and under-estimate dependencies),
Python's sys.settrace (which is too invasive and inefficient),
and profilers (which are designed to provide aggregate statistics
post-execution).
Proposed solution
After tinkering with various magical ways to gather this data using Python internals, I found out that none of them really fit all the requirements of my use case. What ended up working was something simple but ultimately more reliable and efficient:
- decorate all the functions whose code you want to track. The decorator implements its own call stack, separate from Python's, that tracks just these functions' calls.
- the decorator also hooks into the
__globals__of the function object (the dictionary of globals available to the function), and tracks every access to it1.
The only downside is that you have to explicitly decorate the functions/classes you want to track (you could do this automatically with an import hook, but that's perhaps too much magic). The full code + an example is in this gist.
The decorator
The @track decorator simply modifies a function f to emit an event to the
global Tracer object (defined below) right before and after it
is called:
from types import FunctionType
from functools import wraps
from typing import Optional

class TracerState:
    current: Optional['Tracer'] = None

def track(f: FunctionType):

    @wraps(f) # to make the wrapped function look like `f`
    def wrapper(*args, **kwargs):
        tracer = TracerState.current
        if tracer is not None:
            tracer.register_call(func=f) # put call to `f` on stack
            result = f(*args, **kwargs)
            tracer.register_return() # pop call to `f` from stack
            return result
        else:
            return f(*args, **kwargs)

    return wrapper
The tracer
Most importantly, the tracer keeps track of calls to decorated functions by
putting a call on the stack right
before a decorated function is called, and popping the top call when a decorated
function returns. Using the call stack, you can derive all sorts of other useful
information. For example, the implementation below uses the stack to build a dynamic call
graph (represented as a list of edges
for simplicity). It's implemented as a context
manager
that only tracks calls that happen inside a with block:
from typing import Callable

class Tracer:
    def __init__(self):
        # call stack of (module name, qualified function/method name) tuples
        self.stack = []
        # list of (caller module, caller qualname, callee module, callee
        # qualname) tuples
        self.graph = []

    def register_call(self, func: Callable):
        # Add a call to the stack and the graph
        module_name, qual_name = func.__module__, func.__qualname__
        self.stack.append((module_name, qual_name))
        if len(self.stack) > 1:
            caller_module, caller_qual_name = self.stack[-2]
            self.graph.append((caller_module, caller_qual_name,
                               module_name, qual_name))

    def register_return(self):
        self.stack.pop()

    def __enter__(self):
        TracerState.current = self
        return self

    def __exit__(self, exc_type, exc_value, traceback):
        TracerState.current = None
Note that we use the qualified name of a function, which contains all the nested class names in the case of methods.
A minimal example
You can already use this as follows:
In [1]: @track
   ...: def f(x):
   ...:     return x + 1
   ...:

In [2]: @track
   ...: def g(x):
   ...:     return f(x) + 1
   ...:

In [3]: with Tracer() as t:
   ...:     g(23)
   ...:

In [4]: t.graph
Out[4]: [('__main__', 'g', '__main__', 'f')]
Adding globals tracking
When a function f is called, how does Python know how names in the code of f
correspond to values in the program? You can read about this at length in
Python's documentation,
but the gist of it is that the relevant scopes are looked up in the following
order:
- local:
func's own scope, - enclosing: any scopes of functions inside which
funcis defined, accessible throughfunc.__closure__ - global: the the namespace of the function's module, accessible through
func.__globals__. - builtin: Python's imported-by-default objects
It even has a "catchy" acronym: the LEGB rule2. For now, we'll assume there's
no enclosing scope. In this case, we are really only interested in accesses to
__globals__. As it turns out, we can substitute a function's __globals__ -
which is a dictionary - with a modified object that behaves exactly the same but
also tracks accesses. For this, we add a register_global_access method to
Tracer (which adds globals to the graph as key-value pairs to disambiguate
them from function calls), and define a simple subclass of dict:
class Tracer:
    ...

    def register_global_access(self, key: str, value): # <- ADD THIS METHOD
        assert len(self.stack) > 0
        caller_module, caller_qual_name = self.stack[-1]
        self.graph.append((caller_module, caller_qual_name, {key: value}))

    ...

from typing import Any

class TrackedDict(dict):
    def __init__(self, original: dict):
        self.__original__ = original

    def __getitem__(self, __key: str) -> Any:
        value = self.__original__.__getitem__(__key)
        if TracerState.current is not None:
            tracer = TracerState.current
            tracer.register_global_access(key=__key, value=value)
        return value
Implementing the strategy is somewhat complicated by the fact that __globals__
is a read-only attribute and can't be updated in-place. The below helper
copies a function, keeping everything the same except for using a TrackedDict
for the globals:
import copy
from functools import update_wrapper

def make_tracked_copy(f: FunctionType) -> FunctionType:
    result = FunctionType(
        code=f.__code__,
        globals=TrackedDict(f.__globals__),
        name=f.__name__,
        argdefs=f.__defaults__,
        closure=f.__closure__,
    )
    result = update_wrapper(result, f)
    result.__module__ = f.__module__
    result.__kwdefaults__ = copy.deepcopy(f.__kwdefaults__)
    result.__annotations__ = copy.deepcopy(f.__annotations__)
    return result
Note that, even though we use
update_wrapper,
some properties of f must be carried over manually to f's copy; maybe there
are some others you need to copy as well depending on your use case. You can now
modify the track decorator as
def track(f: FunctionType):
    f = make_tracked_copy(f) # add this line

    @wraps(f)
    ...
A more interesting example
Here's a more interesting example of all the stuff we covered so far in action: tracking global variables, functions, and even nested class methods:
A = 23
B = 42

@track
def f(x):
    return x + A

class C:
    @track
    def __init__(self, x):
        self.x = x + B

    @track
    def m(self, y):
        return self.x + y

    class D:
        @track
        def __init__(self, x):
            self.x = x + f(x)

        @track
        def m(self, y):
            return y + A

@track
def g(x):
    if x % 2 == 0:
        return C(x).m(x)
    else:
        return C.D(x).m(x)
As expected, you get different results for the two branches of g:
In [1]: with Tracer() as t:
   ...:     g(23)
   ...:

In [2]: t.graph
Out[2]:
[('__main__', 'g', {'C': __main__.C}),
 ('__main__', 'g', '__main__', 'C.D.__init__'),
 ('__main__', 'C.D.__init__', {'f': <function __main__.f(x)>}),
 ('__main__', 'C.D.__init__', '__main__', 'f'),
 ('__main__', 'f', {'A': 23}),
 ('__main__', 'g', '__main__', 'C.D.m'),
 ('__main__', 'C.D.m', {'A': 23})]

In [3]: with Tracer() as t:
    ...:     g(42)
    ...:

In [4]: t.graph
Out[4]:
[('__main__', 'g', {'C': __main__.C}),
 ('__main__', 'g', '__main__', 'C.__init__'),
 ('__main__', 'C.__init__', {'B': 42}),
 ('__main__', 'g', '__main__', 'C.m')]
Beyond the prototype
The code so far already has all the key components of a solution. Even better, it's easily customizable: it's up to you to decide whether some calls or globals should be excluded, how to respond to changes in dependencies, etc. To make this scaffolding more robust and practical, you might want to add a few minor improvements. I found the following helpful:
- replace global variable values with content hashes, because otherwise you might end up tracking a lot of state that is not garbage-collected
- apply the decorator to entire classes by decorating each of their methods automatically. This saves you at least some of the manual work!
- filter out function/method/class accesses when tracking globals accesses.
As you can see above,
C.D.__init__accesses the global variablef, but you probably don't care about this most of the time. - check for
closures using
the
__closure__attribute of the function being called3. - make the decorator work well with other decorators: Python decorators are
great, but also a total anarchy. Anybody can use something like
lambda x: Noneas a decorator! If it's in your power, you should put@trackon the bottom of decorator stacks (i.e. directly over the function definition). Otherwise, cross your fingers that whoever implemented the decorators in your code was nice and exposed a__wrapped__attribute. Take a look at the Python docs. - use import hooks to automatically decorate your code at import time, if you dare.
What doesn't work, and why
What follows is a tour through some Python tools/internals that can address parts of the problem, but ultimately fail to satisfy all requirements:
sys.settraceis a solid alternative, but introduces too much unavoidable overhead in practical interactive scenarios, and can't track dynamic accesses to the globals.- profilers like cProfile introduce less overhead than
sys.settrace. However, they don't track per-call dependencies, don't give you runtime control over what the program does (so you can't e.g. react to a dependency that you fundamentally can't track), and make it harder to extract full dependency information. - static analysis can discover more/fewer dependencies than the ground truth, and is altogether messier to implement.
sys.settrace
Python is a famously (notoriously?) hackable language: it lets you hook into a
lot of the internal machinery of the interpreter itself. One such piece of magic
is sys.settrace,
which allows you to install a hook that gets called for each of the main events
of the interpreter: function calls/returns, and even executing a single line of
code in a function (for example, this is how
coverage can be so fine-grained).
Using sys.settrace, we can obtain something very similar to the solution
developed above, but without the need to explicitly
decorate your code. Here is a minimal example of a stateful context manager
using settrace to maintain a call stack of the functions that get called and
the modules they originate from:
import sys, types

class Tracer:
    def __init__(self):
        # stack of (module name, function name) tuples
        self.call_stack = []

    def __enter__(self):
        def tracer(frame: types.FrameType, event: str, arg):
            # the name of the function being executed
            func_name = frame.f_code.co_name
            # the name of the module in which the function is defined
            module_name = frame.f_globals.get("__name__")
            if event == 'call': # function call
                self.call_stack.append((module_name, func_name))
                print(f"Calling {module_name}.{func_name}")
            elif event == 'return': # function return
                ret_module, ret_func = self.call_stack.pop()
                print(f"Returning from {ret_module}.{ret_func}")
            else:
                pass
            return tracer

        sys.settrace(tracer) # enable tracing
        return self

    def __exit__(self, exc_type, exc_value, traceback):
        sys.settrace(None) # disable tracing
The frame object is what Python puts on its call
stack, and contains data about the
function being called, its
bytecode, who called
it, etc. You can use this context manager as follows:
### in funcs.py
def f(x):
    return x + 1

### in IPython session
In [1]: from funcs import *

In [2]: def g(x):
   ...:     return f(x) + 1
   ...:

In [3]: with Tracer():
   ...:     g(23)
   ...:
Calling __main__.g
Calling funcs.f
Returning from funcs.f
Returning from __main__.g
Calling funcs.__exit__ # you'd have to manually remove this one
This can be extended with more features much like the decorator-based
tracer. There are some settrace-specific problems
you have to deal with though:
- limit the dependencies to user code by looking at the module in which the function is defined, getting its path, and deciding if it's a user's file or not.
- get the qualified name: this is frustratingly not readily available as
part of the
frameobject. You need some hacks to extract it:
def get_qualname_from_frame(frame: types.FrameType) -> str:
    arg_names = frame.f_code.co_varnames[: frame.f_code.co_argcount]
    if len(arg_names) > 0 and arg_names[0] == 'self':
        cls_candidate = frame.f_locals['self'].__class__
        method_candidate = cls_candidate.__dict__.get(frame.f_code.co_name)
        if method_candidate is not None and method_candidate.__code__ is frame.f_code:
            return method_candidate.__qualname__
    return frame.f_code.co_name
- skip over non-function frames: the interpreter assigns comprehensions,
generators and
lambda-calls their own frames. You have to check for this usingframe.f_code.co_name, and assign their dependencies to the closest "actual" function call on the stack.
sys.settrace's unavoidable overhead
A good reason to avoid settrace in production code is that it's too magical
for its own good. However, the
real deal-breaker for my use case was the impossible-to-avoid factor by which it
slows down some kinds of code.
The crux is that the trace function is inherently called for each call event,
including calls to library functions that you don't care about tracking, because
they typically don't change over the course of a months-long project. For
relatively fast function calls (on the order of seconds), you may get an
order-of-magnitude slowdown if the call involves many sub-calls. This is
unacceptable for interactive workflows!
You might think you could fix that with a bit of manual work by excluding such library code from the tracing. Indeed, you can define a simple context manager that temporarily suspends the current trace:
class Suspend:
    def __init__(self):
        self.suspended_trace = None

    def __enter__(self) -> "Suspend":
        if sys.gettrace() is not None:
            self.suspended_trace = sys.gettrace()
            sys.settrace(None)
        return self

    def __exit__(self, *exc_info):
        if self.suspended_trace is not None:
            sys.settrace(self.suspended_trace)
            self.suspended_trace = None
Then you can use it like this:
def my_tracked_func(...):
    ...
    a = another_tracked_func()
    with Suspend():
        b = some_library_calls_you_dont_want_to_track(a)
        ...
    ...
However, there are cases when you simply can't do that! To give a concrete
example, I was going though the code for
this
blog post, and I ran into an interesting scenario. A user-defined function f
was passed into
jax.lax.scan,
as a way to speed up certain applications of f:
def run_fsm(fsm: FSM, inputs):
  def f(s, x):
    y  = jp.einsum('x,s,xsy->y', x, s, fsm.R)
    s1 = jp.einsum('x,s,xst->t', x, s, fsm.T)
    return s1, (y, s1)
  _, (outputs, states) = jax.lax.scan(f, fsm.s0, inputs) # THIS IS BAD
  return outputs, jp.vstack([fsm.s0, states]
Because you're passing your function to the library and it can call it however
it likes, you lose the ability to separate the executions of your code from
those of library code. The Suspend trick can't work: you're forced to trace
all the internal calls the library makes alongside the calls to your code.
cProfile
A profiler is a dynamic program analysis tool typically used to pinpoint performance bottlenecks in code. There are two main kinds:
- statistical profilers sample a program's state (e.g. call stack, memory allocation) at regular intervals. This reduces overhead, while still detecting functions where the program spends a lot of time.
- deterministic profilers by contrast record every function call that happens in the program, and accordingly suffer higher overhead.
In dependency tracking, failing to notice even a single dependency that is fast
and gets called rarely can have disastrous results, so statistical profilers are
not really an option: you need a deterministic one. Since Python's interpreter
adds so much overhead anyway, Python's built-in (deterministic) profilers
don't introduce that much over-overhead. Of the two, cProfile is faster. Here's the minimal
implementation of a tracer based on profiling:
import cProfile
import pstats

class ProfilingTracer:
    def __init__(self):
        self._profiler = cProfile.Profile()

    def __enter__(self):
        self._profiler.enable()
        return self

    def __exit__(self, exc_type, exc_value, traceback):
        self._profiler.disable()
        stats = pstats.Stats(self._profiler)
        stats.print_callees()
Conveniently, the output of the profiler has a method print_callees that
prints all the functions that were called by each given function in the profiled
block of code. We can run it on the code from
before to get this (simplified for readability) output:
Function                                  called...
                ncalls  tottime  cumtime
(__init__)  ->       1    0.000    0.000  (f)
(m)         ->
(g)         ->       1    0.000    0.000  (__init__)
                     1    0.000    0.000  (m)
                     1    0.000    0.000  (__init__)
                     1    0.000    0.000  (m)
(m)         ->
(f)         ->
(__init__)  ->
The downsides of this approach become clear:
- data is aggregated across all calls to a given function: in the tracked
code, we call
gtwice, and the two calls have different dependencies. But in the final report of the profiler, the two calls are grouped together. So we have no way of tracking per-call dependencies based on this data! - no qualified names and globals: you would have to do some extra work (e.g. looking at
line numbers, which do appear in the profiler report) to disambiguate the
classes methods come from. And as with
settrace, you have no way to detect globals accesses. - no runtime control over dependencies: the profiler report is an after-the-fact summary of what happened; you don't have the option to abort if you detect a bad dependency.
Of course, it's not surprising that profilers have a hard time tracking fine-grained dependencies: they weren't designed for that!
Static analysis
Finally, static analysis is a collection of methods for deducing program properties from source code alone, i.e. without running the program. For example, code2flow is a static call graph builder for Python. In Python, static analyses typically proceed from the abstract syntax tree and/or the bytecode.
This approach doesn't interact with your running program at all, which is great for performance and generally letting your code work the way it's supposed to. Unfortunately, it's fundamentally flawed for many other reasons:
- false positives: suppose
f's source code contains calls togandh, but some calls tofuse onlyg, and others onlyh. A static analysis would miss that and declaregandhas dependencies of all calls. - false negatives: your function can call another function in all sorts of
weird ways that cannot be inferred from the syntax tree and/or bytecode alone. For an extreme
example, consider something like
a = eval('my_' + 'function(42)'). Because of variations of the halting problem, it's both difficult and impossible for a static analysis to determine what a function will do at runtime. - high implementation complexity: even if you adopt a best-effort approach,
you have to do a lot of work to figure out the precise function called by
an expression like
a().b().c().
Overall, using static analysis is not worth the hassle given the ultimately coarse-grained information it can provide.
I learned this trick from this blog post ↩︎
Makes you wonder what happened to leg A? This is out of scope for this blog post. ↩︎
Closures are more complex to track than code available at import time. To make life simpler, you may choose to detect closures at runtime and raise an error to disable them. ↩︎